Percolation in the Erdős–Rényi model, and beyond
This set of notes is created to procrastinate the production scientific results and to relive the excitement I felt during PHYS 7653, advanced statistical mechanics, taught by Prof. Veit Elser in Fall 2019.
Model
The model is introduced by two mathematical giants, Paul Erdős and Alfréd Rényi in 1960. It has the following inputs:
a set of \(n\) points as vertices.
a probability \(p=\frac{d}{n-1}\) which describes the probability of having an edge between any pair of vertices.
Note that the model lives in \(0\) dimensions: there is no embedding into a manifold. We are interested in the limit where \(n\to\infty\) and \(d\) fixed. The probability is defined such that \(\left\langle \textrm{degree of any given vertex} \right\rangle=d\). Macroscopically, this model describes a set of graphs.
Calculations on small clusters
A simple calculation we can do is the distribution of degree for a given vertex:
\[P(k)=\binom{n-1}{k}p^k(1-p)^{n-1-k}.\]Taking the limit of \(n\to\infty\) and using Stirling's approximation, we find that the probability reduces to a Poisson distribution:
\[P(k)\to \frac{d^k}{k!}e^{-d}.\]We want to calculate some more interesting quantities, say the number of triangles in the system. To do this, let's define \(S_\Delta\) to be the set of all triples in the system: \(|S_{\Delta}|=\binom{n}{3}\). Define the indicator \(\theta(t)\) to be \(1\) if \(t\) is a triangle and \(0\) if not. Since all triplets in the system are equivalent,
\[\left\langle N_\Delta \right\rangle = \sum_t {\theta(t)}=|S_{\Delta}|\left\langle \theta(t_0) \right\rangle=|S_{\Delta}|p_{t_0=\Delta}.\]Given \(t_0\), if it is indeed a triangle, then its three edges have to be connected; also, its three vertices cannot be connected to any other vertex. Hence, \(p_{t_0=\Delta}=p^3(1-p)^{3(n-3)},\) which yields
\[\left\langle N_\Delta \right\rangle\sim d^3e^{-3d}.\]One can similarly calculate the expected number for any other graph with \(V\) vertices and \(E\) edges. One will find that
\[\left\langle N \right\rangle\sim n^{V-E}e^{-Vd}.\]Through this calculation, we find that forming cycles are costly: the only subgraphs whose quantities scale linearly with \(n\) are trees.
All the graphs we studied before are finite, small clusters compared to the system size \(n\): there might be the case where there exists a cluster whose size scales linearly with \(n\). When this happens, we say that the system percolates. The central question to ask in this note is: when will the system percolate?
At this moment, the readers informed in physics should feel the plug in their stomach: this vaguely has the flavor of asking when a bosonic system will condense. This will be made more precise in a later section. The physical approach we often take on BECs is that, we calculate the thermal distribution of bosonic particles and see if the thermal distribution can take all the particles; if it can't take all the particles, the amount that overflows (which is a macroscopic quantity) condenses into the ground state. We will ask a similar question here: What fraction of vertices are in finite clusters as \(n\to\infty\)?
Percolation transition
As we have shown above, as \(n\to\infty\), the most important contributions to these clusters come from trees. Let's calculate the number of trees of size \(k\), \(n_k\). Similar to before, we take the set of all \(k\)-tuples and calculate the expectation that they form trees. For a particular tree configuration in a particular tuple, the probability is \(p^{k-1} e^{-kd}\); for a particular cluster \(k\), there are \(k^{k-2}\) different labeled trees. In the end, the expected number of trees with size \(k\) is
\[\left\langle n_k \right\rangle=\binom{n}{k}p^{k-1} e^{-kd}k^{k-2}=\frac{n}{d}\frac{k^{k-2}}{k!}(de^{-d})^k.\]Let \(f\) be the fraction of vertices in finite clusters, similar to the fraction of particles not in the condensate.
\[f=\frac{1}{n}\sum_{k=1}^\infty k\left\langle n_k \right\rangle=\frac{1}{d}\sum_{k=1}^\infty \frac{k^{k-1}}{k!}(de^{-d})^k=\frac{1}{d}W(de^{-d})\]where \(W\) is the Lambert \(W\) function. Although there are many conventions, here we take the convention where \(W(de^{-d})=d\). Hence \(f=1\) and there is no percolation. The reader is now advised to leave the website, for they seem to have wasted some of their precious time and should avoid further sunken cost.
What is wrong with the calculation before? One - physically we know that the calculation can't be right. In the limit \(d\gg0\), almost all vertices should be in the same cluster. Two - mathematically the treatment is not rigorous: the Lambert \(W\) function isn't really well defined as we have written it!
Lambert W function
Note that the Lambert \(W\) function is defined as the inverse of the function \(de^{-d}\): that is, \(W(d)e^{-W(d)}=de^{-d}\).
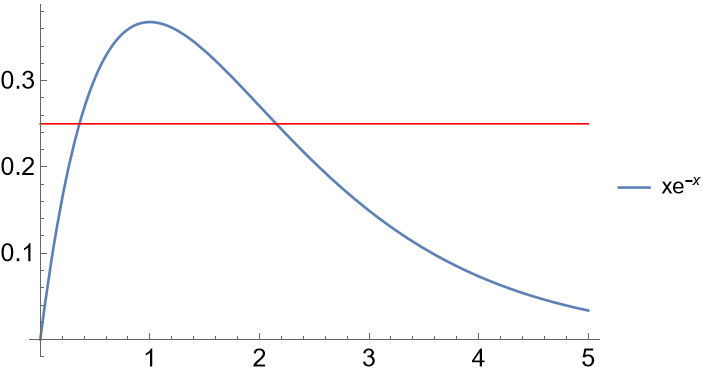
However, the inverse is not well defined: the equation \(de^{-d}=0.25\) has two solutions, \(d_1=0.36\) and \(d_2=2.15\). Which branch are we picking? Does \(W(0.25)\) equal to \(0.36\) or \(2.15\)? We define \(\tilde{d}(d)\) to be the other solution of \(\tilde{d}e^{-\tilde{d}}=de^{-d}\).
To make sure that \(W(0)=0\), we will pick the branch related to \(d_1\); that is, the branch with smaller \(d\) values. Now \(W(x)\) is only defined on \([0,1/e]\) whose values run from \(0\) to \(1\). Hence, the function \(W(d e^{-d})\) has the following definition:
\[W(de^{-d})=\left\{ \begin{aligned}&d,\quad d\leq 1\\&\tilde{d}(d),\quad d\geq 1\end{aligned}\right.\]This means that our calculation of \(f\) – number of vertices in small clusters – is actually not correct. It will be
\[f=\frac{W(de^{-d})}{d}=\left\{ \begin{aligned}&1,\quad d\leq 1\\&\frac{\tilde{d}(d)}{d},\quad d\geq 1\end{aligned}\right.\] 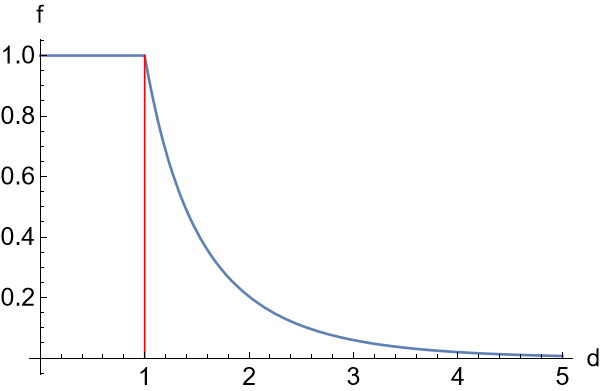
Duality
Since \(W(de^{-d})=W(\tilde{d}e^{-\tilde{d}})\), it is natural to suspect that the system will behave similarly although we have different values for \(d\). To see that, we consider the following quantity: let \(s\) be the size of tree a vertex belongs to, averaged over vertices in finite clusters. Define \(z=de^{-d}\). By construction,
\[s=\frac{\sum_{k=1}^\infty k(k\cdot n_k)}{\sum_{k=1}^\infty k n_k}=\frac{zW'(z)}{W(z)}.\]Given that \(z=W(z)e^{-W(z)}\), \(W'=\frac{e^W}{1-W}\). Hence
\[s=\frac{1}{1-W(z)}=\left\{ \begin{aligned}&\frac{1}{1-d},\quad d\leq 1\\&\frac{1}{1-\tilde{d}},\quad d\geq 1\end{aligned}\right.\]We hence see the duality: at either \(d\) or \(\tilde{d}\), the system exhibits the same behavior, except for the percolating cluster.
BEC as a graph model
I would like to sketch how BEC becomes a graph model. Consider the partition function of \(N\) bosons:
\[{\mathcal Z}=\textrm{Tr}e^{-\beta H}\sim\sum_{p\in S_N}\int\prod_{i=1}^N d^3r_i\left\langle r_1\dots r_N|e^{-\beta H}|r_{p(1)}\dots r_{p(N)} \right\rangle.\]Forgetting all the macroscopic details, we can try to study the structure of the permutation \(p\). Which kinds of permutations dominate the sum? It is not unimaginable that when BEC condensation happens, the sum is dominated by permutations containing a cycle of length order \(n\) - this is called cycle percolation, and it has been studied intensively[1][2].
References
| [1] | A. Suto, Percolation transition in the Bose gas (1993). DOI |
| [2] | A. Suto, Percolation transition in the Bose gas II (2002). arXiv |